The Long Beach housing prices December 2021 was up 14.50% over November 2021. We’re forecasting that Southern California next year will be more of the same, but we’ll get into that later.
For now, let’s talk about what you need to know about Long Beach Housing prices in December 2021 for January 2022.
As your local Long Beach real estate agent, I want to help you understand the local trends so you can use them to your advantage.
Comparing December 2021 to December 2020 for Long Beach Houses
| Long Beach Homes | 2021 | 2020 | Change |
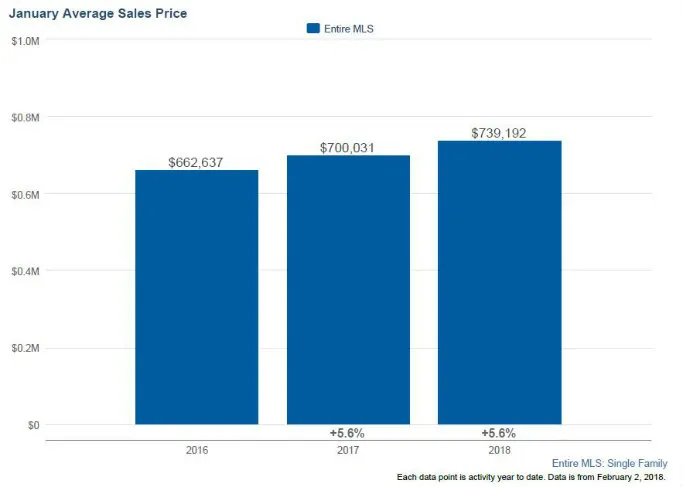
| Average selling prices | $952,247 | $831,860 | +14.50% |
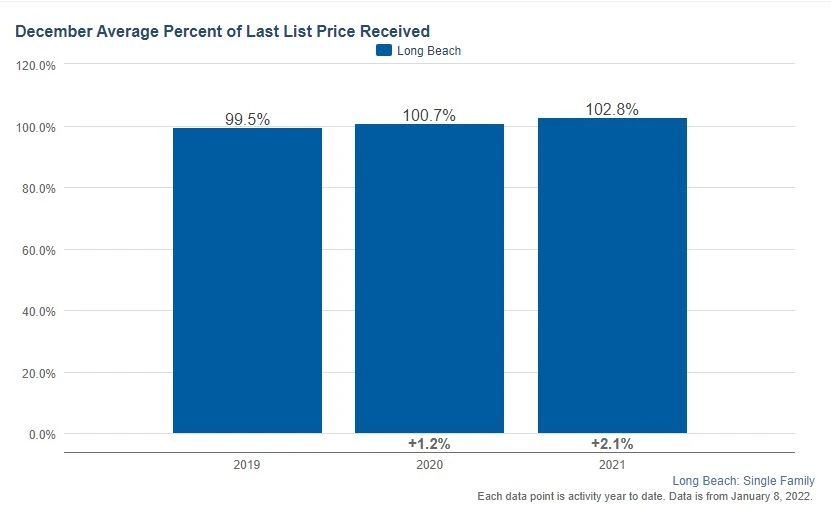
| Percentage of the listed price that homes sold for | 102.80% | 100.7% | +2.10% |
| Average days on market | 18 | 26 | -30.80% |
| Supply of Homes for sale in Months | 1.20 | 1.80 | -33.30% |
| Average price per square foot | $618.00 | $537.00 | +15.10% |
| Closed Sales for the year | 2,284 | 2,073 | +10.20% |
List to Sale Ratio: The Percentage of the Listed Price that Properties Sell for Gives You Insights
Houses are selling for 102.80% or 2.8% above the listed price. Keep that in mind when you are searching for homes. Think of the listed price as the starting price for “active” listings for sale.
Comparison of Long Beach Homes by Zip Codes in December 2021
Here is a list of December 2021 prices for homes in Long Beach by zip code. These numbers will give you an idea of what to expect when it comes time to buy your next property or sell your current property!
| Long Beach CA Zip Codes | Average Selling Prices May 2021 | Average Days on Market | List to Sale Ratio | Property Type |
|---|---|---|---|---|
| Long Beach CA 90802 | $793,320 | 17 | 104.00% | Homes |
| Long Beach CA 90803 | $1,663,449 | 34 | 100.80% | Homes |
| Long Beach CA 90804 | $767,916 | 19 | 102.90% | Homes |
| Long Beach CA 90805 | $612,391 | 14 | 103.90% | Homes |
| Long Beach CA 90806 | $677,802 | 20 | 104.10% | Homes |
| Long Beach CA 90807 | $1,007,920 | 18 | 103.60% | Homes |
| Long Beach CA 90808 | $930,956 | 13 | 102.70% | Homes |
| Long Beach CA 90810 | $602,661 | 20 | 103.80% | Homes |
| Long Beach, CA 90814 | $1,184,635 | 22 | 102.70% | Homes |
| Long Beach CA 90815 | $1,015,241 | 15 | 102.50% | Homes |
Video Summary of Long Beach Housing Prices 2021
A quick video summary of this real estate blog post for Long Beach real estate statistics. Some of my visitors like to watch the video version over reading a blog post. So, grab a bag of popcorn and something to drink for this quick video.
When will housing prices go down in Long Beach, California?
I wish I knew. I like a normal real estate market. Our current economy has a lot to do with interests and home pricing. If the current economic policies involve more spending than trying to stabilize that, a downturn in pricing may happen.
It is really hard to forecast when. Right now, I’m continuing to see multiple offers on houses and condos throughout the city.
Your Next Steps to Buying a Home or Investing in a Property
To be prepared as a home buyer or real estate investor, fill out my 5-minute buyer questionnaire.
If you have a desire to sell your home in Long Beach, we would love to explain our home selling process and give you a Home Seller’s Guide authored by Jay Valento.
All real estate statistics data is from the California Regional Multiple Listing Service.
Hot Topics to Read about Bidding Wars
How My Clients Won in a Bidding War for Downtown Long Beach Condo
Continue viewing Long Beach homes for sale or create your own custom home search today.