By Jay Valento in Long Beach Housing Prices
What is really happening in the Long Beach real estate marketplace? Let’s look at Belmont Heights real estate market 2019 and see what we can learn from the past for pricing homes in 2020.
 How Much Did Belmont Heights Homes Sell For in 2019?
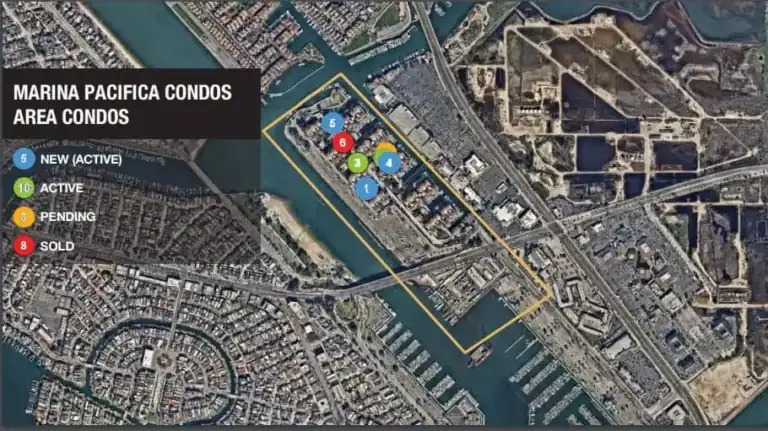
I looked at homes for sale in Belmont Heights today to see what is happening to inform my clients. I discovered that there are 5 houses in escrow as of today and only 7 Belmont Heights homes for sale in January so far.
Let’s look at the numbers for Belmont Heights neighborhood in Long Beach today. I want to compare the past year of numbers to see trends in pricing and marketing.
- In 2019, 67 single-family homes in Belmont Heights sold.
- The average selling price was $1,109,802.
- Homes in Belmont Heights as selling within 58 days after being listed for sale.
- The List to Sale Ratio is 97.66% in Belmont Heights verse 98.85% in Long Beach overall
- Average price per square foot is $609 overall
Why are Belmont Heights Real Estate Statistics Important to Home Buyers & Sellers?
Real Estate statistics can be useful to you if you are selling or buying properties. They help you to determine if the housing market is hot, cold or stable.
As a real estate professional, I find it is best to look at the numbers to advise my buyer clients and seller clients effectively. I go into our California Regional multiple listing service and research the data. I don’t use advertising portals like Zillow, Trulia or Realtor.com to find the real numbers. Some of there numbers are off by as much as 30%….scary.
Then, with my research in hand, I can advise you so you can make good decisions.
List to Sale Ratio Determines Market Conditions
I look at the List to Sale Ratio to determine how hot or cold the market is for pricing. This ratio shows the percentage of the listing price that homes sold for. 100% represents a full price offer.
How To Determine the List to Sale Ratio
How do you determine the list to sale ratio? You take the average selling price in Belmont Heights was $1,109,802 and the listed price average was $1,136,317. Then, you divide the selling price/listing price, I get the List to Sale ratio. (I know, math right).
If there is a small number of homes for sale on the market and demand is high, you may be competing with other buyers for a home. In that case, you need to write an offer above the listing price to get the house.
List to Sale Ratio of 115% in Long Beach
[callout]For example, I represented a client who bought a home in 2019 in Bixby Knolls. The house was listed for $675,000 and there were multiple offers on the house. My client really wanted the house and paid $780,000 for it. That is 115.55% over the listed price. The market was hot in Bixby Knolls at the time.[/callout]
Always Review Market Statistics with Your California Realtor®
When reviewing home prices with my clients, I always try to do it just like an appraiser would do.
- I look at recent sales in the same neighborhood in the past 3 to 6 months
- Review the square footage ranges.
- Days on market
- List to Sale Ratio and other factors to determine a true market value
I want my seller clients to price their homes to get the most money the buyers are willing to pay for a home. My home buyer clients need to review numbers to make wise offers.
Words of Wisdom About Housing Prices
Please don’t rely on advertising portals like Zillow, Trulia and Realtor.com for pricing. Those are all just computer generated pricing models that don’t take into consideration the items above.
One of my clients thought I get prices from Zillow like they did. I said no. I get them from our MLS and other data sources like I have for the past 27 years. I’m interested in reliable data sources and you should too.