 It’s been a crazy year in the Huntington Beach CA real estate August 2021 with skyrocketing and inventory plummeting.
We’re forecasting that Huntington Beach will be the same next year as this year.
For now, let’s talk about what you need to know about Huntington Beach CA real estate August 2021.
Overall Huntington Beach Housing August 2021
I like to look at the average pricing city wide and then break it down by zip code and neighborhood. This method gives me, as a real estate agent, insights into the Huntington Beach real estate. Which I pass unto my clients.
Huntington Beach CA real estate August 2021 Comparison Flow Chart
| Huntington Beach Homes | Last 30 days | Last 6 months | Last 12 months |
| Sold | 125 | 813 | 1,403 |
| Average List Price Sold | $1,496,611 | $1,405,489 | $1,384,037 |
| Average Price per Square Foot | $652.00 | $647.00 | $633.00 |
| Average Sales Price to List Price Ratio | 101.00% | 102% | 101% |
[callout]The Sales Price to List Ratio is how much over or under Huntington Beach homes are selling for. In facts above, houses are selling for 101% of the listed price which is 1% over the listed price.[/callout]
How To Use Huntington Beach CA real estate August 2021 To Your Advantage
When you fall in love with a house, I will use the real estate multiple listing service (MLS) and recent sales in the past 3 months and 6 months to establish home values. I don’t look at Redfin, Realtor.com or Zillow to figure out market values and neither do appraisers that work for a bank.
You need to look at the real numbers otherwise your idea of value can be way off from some of these online estimator companies.
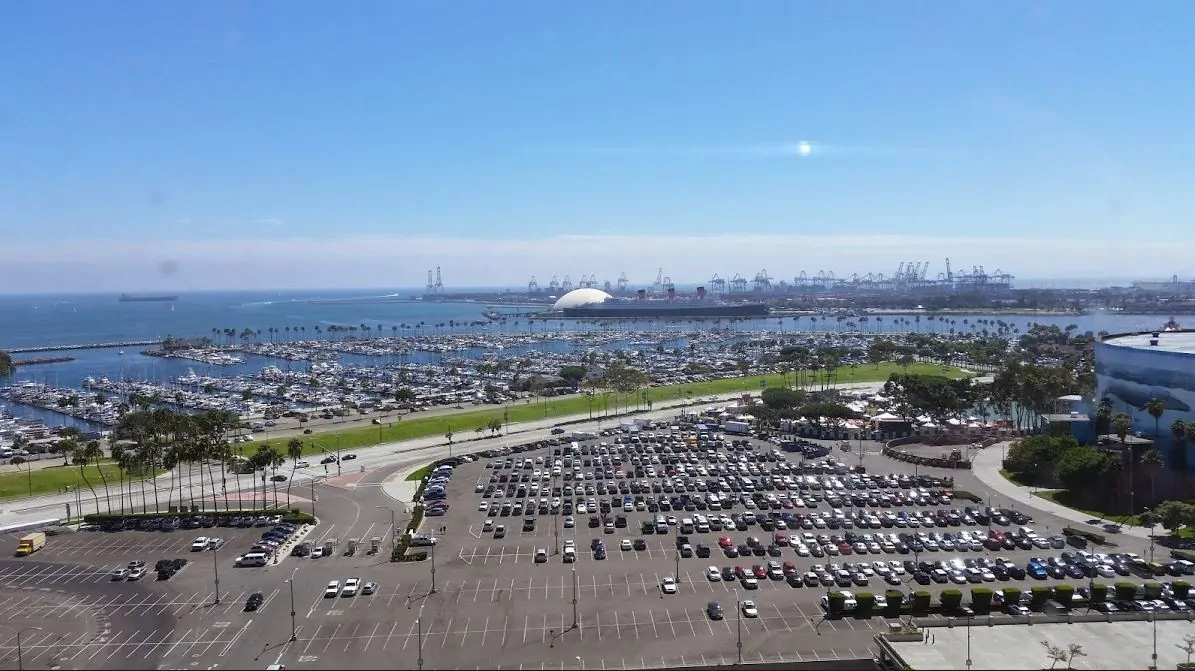
Look at the Huntington Beach homes that sold on an interactive map and compare Huntington Beach to Long Beach housing prices for August 2021.